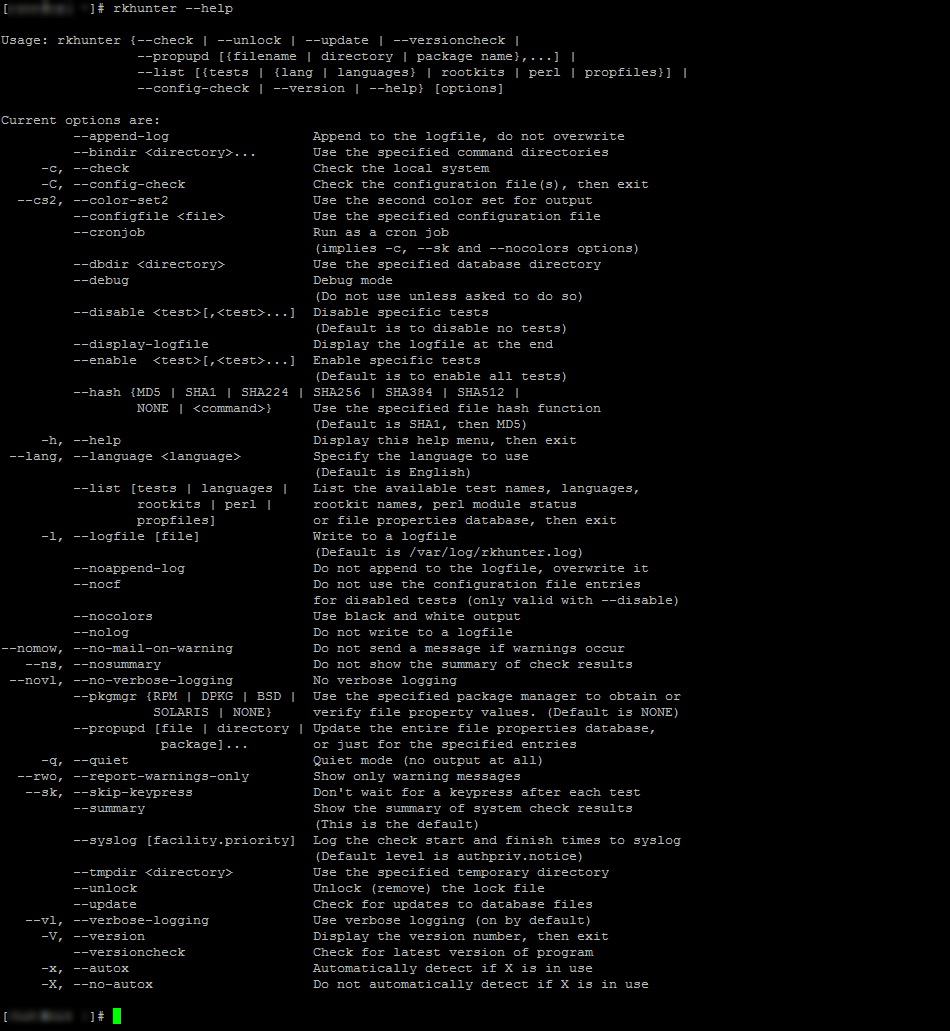
The unhide command for RKHUNTER in CentOS 7 must be installed with the following “Yum” command:
yum install unhide unhide-tcp
I have detected that rkhunter need this file to be able to unhide stuff!
Info: Starting test name ‘malware’
Performing malware checks
Info: Test ‘deleted_files’ disabled at users request.
Info: Starting test name ‘running_procs’
Checking running processes for suspicious files [ None found ]
Info: Starting test name ‘hidden_procs’ Info: Unable to find the ‘unhide’ command Info: Unable to find the ‘unhide-linux’ command
Checking for hidden processes
[ Skipped ]
Set runtime for fs.suid_dumpable #sysctl -q -n -w fs.suid_dumpable=0
If fs.suid_dumpable present in /etc/sysctl.conf, change value to “0”else, add “fs.suid_dumpable = 0” to /etc/sysctl.conf
if grep –silent ^fs.suid_dumpable /etc/sysctl.conf ; then sed -i ‘s/^fs.suid_dumpable.*/fs.suid_dumpable = 0/g’ /etc/sysctl.conf else echo“” >> /etc/sysctl.conf echo“# Set fs.suid_dumpable to 0 per security requirements” >> /etc/sysctl.conf echo“fs.suid_dumpable = 0” >> /etc/sysctl.conf
fi
Buffer Overflow Protection
This section helps mitigate against Buffer Overflow attacks (BOF).
Enable ExecShield
Helps prevent stack smashing / BOF.
Enable on current kernel: sysctl -w kernel.exec-shield=1
Add to /etc/sysctl.conf:
kernel.exec-shield = 1
Check / Enable ASLR
Set runtime for kernel.randomize_va_space sysctl -q -n -w kernel.randomize_va_space=2
Add kernel.randomize_va_space = 2 to /etc/sysctl.conf if it does not already exist.
Enable XD or NX Support on x86 Systems
Recent processors in the x86 family support the ability to prevent code execution on a per memory page basis. Generically and on AMD processors, this ability is called No Execute (NX), while on Intel processors it is called Execute Disable (XD). This ability can help prevent exploitation of buffer overflow vulnerabilities and should be activated whenever possible. Extra steps must be taken to ensure that this protection is enabled, particularly on 32-bit x86 systems. Other processors, such as Itanium and POWER, have included such support since inception and the standard kernel for those platforms supports the feature.
Check bios and ensure XD/NX is enabled, not relevant for VM’s.
Disable SSH Support for .rhosts Files
SSH can emulate the behavior of the obsolete rsh command in allowing users to enable insecure access to their accounts via .rhosts files.
To ensure this behavior is disabled, add or correct the following line in /etc/ssh/sshd_config:
We’re making it possible for everyone to experience a secure and privacy-respecting Web. We make it easy to get certificates for HTTPS, because ease of use is critical for adoption. We provide certificates free of charge, because cost excludes people. Our certificates are available in every country in the world, because the secure Web is for everyone. We strive to be open and transparent, because these values are essential for trust.
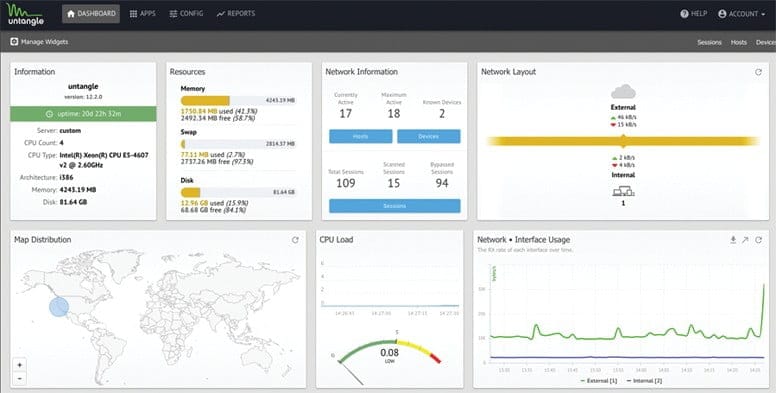
Untangle’s Firewall filters traffic based on IP address, protocol and ports and allows administrators to designate which systems and services (http, ftp, etc.) are publicly available, create a DMZ and perform NAT (with Router), and run as a transparent bridge to complement existing hardware.
Untangle is much more than a firewall. It is, in fact, a Linux distribution that includes a host of software written by other developers. Software includes a Web Filter, Spam Blocker, Spyware Blocker, Virus Blocker, Phish Blocker, Instrusion Prevention, Attack Blocker, OpenVPN, Router, Untangle Reports, and Untangle Platform.
Features include:
Blocks sessions based on simple rules
Rules can be based on a variety of attributes
Custom logging, blocking or passing rules can be created by:
Ruby executable, library, and headers (for Broccoli Ruby bindings)
LibgeoIP
During the process of creating policy scripts the need may arise to find the geographic location for an IP address. Bro has support for the GeoIP library at the policy script level beginning with release 1.3 to account for this need. To use this functionality, you need to first install the libGeoIP software, and then install the GeoLite city database before building Bro.
Libgeoip allows bro to
sudo yum install GeoIP-devel
A country database for GeoIPLite is included when you do the C API install, but for Bro, we are using the city database which includes cities and regions in addition to countries.
Gperftools is a collection of a high-performance multi-threaded malloc() implementation, plus some pretty nifty performance analysis tools
sudo yum install gperftools
Ipsumdump
The ipsumdump program reads IP packets from one or more data sources, then summarizes those packets into a line-based ASCII file. The resulting summary dump is easy to process with text-based tools
#Download the latest version from here
wget http://www.read.seas.harvard.edu/~kohler/ipsumdump/ipsumdump-1.85.tar.gz
tar -xvf ipsumdump-1.85.tar.gz
cd ipsumdump-1.85
./configure --prefix=/usr/
make
sudo make install
wget https://www.bro.org/downloads/release/bro-2.5.tar.gz
tar -xvf bro-2.5.tar.gz

Now change to this directory
/bro/bro-2.5   assuming you created a /bro/ and install in this directory!
./configure
make
sudo make install
The installation will take a while!
by default bro will be install to /usr/local/bro/bin
Modifiy you PATH environment variable to include bro binaries
export PATH=/usr/local/bro/bin:$PATH
To make changes permanent add above line to ~/.bashrc file
A Minimal Starting Configuration
These are the basic configuration changes to make for a minimal BroControl installation that will manage a single Bro instance on the localhost:
In $PREFIX/etc/node.cfg, set the right interface to monitor.
In $PREFIX/etc/networks.cfg, comment out the default settings and add the networks that Bro will consider local to the monitored environment.
In $PREFIX/etc/broctl.cfg, change the MailTo email address to a desired recipient and the LogRotationInterval to a desired log archival frequency.
Now start the BroControl shell like:
broctl
Since this is the first-time use of the shell, perform an initial installation of the BroControl configuration:
[BroControl] > install
Then start up a Bro instance:
[BroControl] > start
If there are errors while trying to start the Bro instance, you can can view the details with the diag command. If started successfully, the Bro instance will begin analyzing traffic according to a default policy and output the results in $PREFIX/logs.
Note
The user starting BroControl needs permission to capture network traffic. If you are not root, you may need to grant further privileges to the account you’re using; see the FAQ. Also, if it looks like Bro is not seeing any traffic, check out the FAQ entry on checksum offloading.
You can leave it running for now, but to stop this Bro instance you would do:
[BroControl] > stop
Browsing Log Files
By default, logs are written out in human-readable (ASCII) format and data is organized into columns (tab-delimited). Logs that are part of the current rotation interval are accumulated in $PREFIX/logs/current/ (if Bro is not running, the directory will be empty). For example, the http.log contains the results of Bro HTTP protocol analysis. Here are the first few columns of http.log:
Logs that deal with analysis of a network protocol will often start like this: a timestamp, a unique connection identifier (UID), and a connection 4-tuple (originator host/port and responder host/port). The UID can be used to identify all logged activity (possibly across multiple log files) associated with a given connection 4-tuple over its lifetime.
The remaining columns of protocol-specific logs then detail the protocol-dependent activity that’s occurring. E.g. http.log‘s next few columns (shortened for brevity) show a request to the root of Bro website:
# method host uri referrer user_agentGETbro.org/-<...>Chrome/12.0.742.122<...>
Some logs are worth explicit mention:
conn.log
Contains an entry for every connection seen on the wire, with basic properties such as time and duration, originator and responder IP addresses, services and ports, payload size, and much more. This log provides a comprehensive record of the network’s activity.
notice.log
Identifies specific activity that Bro recognizes as potentially interesting, odd, or bad. In Bro-speak, such activity is called a “notice”.
By default, BroControl regularly takes all the logs from $PREFIX/logs/current and archives/compresses them to a directory named by date, e.g. $PREFIX/logs/2011-10-06. The frequency at which this is done can be configured via the LogRotationInterval option in $PREFIX/etc/broctl.cfg
If you prefer not to use BroControl (e.g. don’t need its automation and management features), here’s how to directly control Bro for your analysis activities from the command line for both live traffic and offline working from traces.
Analyzing live traffic from an interface is simple:
bro -i en0 <list of scripts to load>
en0 can be replaced by the interface of your choice and for the list of scripts, you can just use “all” for now to perform all the default analysis that’s available.
Bro will output log files into the working directory.
Note
The FAQ entries about capturing as an unprivileged user and checksum offloading are particularly relevant at this point.
To use the site-specific local.bro script, just add it to the command-line:
bro -i en0 local
This will cause Bro to print a warning about lacking the Site::local_nets variable being configured. You can supply this information at the command line like this (supply your “local” subnets in place of the example subnets):
bro -r mypackets.trace local "Site::local_nets += { 1.2.3.0/24, 5.6.7.0/24 }"
Capturing packets from an interface and writing them to a file can be done like this:
sudo tcpdump -i en0 -s 0 -w mypackets.trace
Where en0 can be replaced by the correct interface for your system as shown by e.g. ifconfig. (The -s0 argument tells it to capture whole packets; in cases where it’s not supported use -s65535 instead).
After a while of capturing traffic, kill the tcpdump (with ctrl-c), and tell Bro to perform all the default analysis on the capture which primarily includes :
bro -r mypackets.trace
Bro will output log files into the working directory.
If you are interested in more detection, you can again load the local script that we include as a suggested configuration:
A command-line invocation of Bro typically looks like:
bro <options> <policies...>
Where the last arguments are the specific policy scripts that this Bro instance will load. These arguments don’t have to include the .bro file extension, and if the corresponding script resides under the default installation path, $PREFIX/share/bro, then it requires no path qualification. Further, a directory of scripts can be specified as an argument to be loaded as a “package” if it contains a __load__.bro script that defines the scripts that are part of the package.
This example does all of the base analysis (primarily protocol logging) and adds SSL certificate validation.
You might notice that a script you load from the command line uses the @load directive in the Bro language to declare dependence on other scripts. This directive is similar to the #include of C/C++, except the semantics are, “load this script if it hasn’t already been loaded.”
Note
If one wants Bro to be able to load scripts that live outside the default directories in Bro’s installation root, the BROPATH environment variable will need to be extended to include all the directories that need to be searched for scripts. See the default search path by doing bro--help.
For developers that wish to run Bro directly from the build/ directory (i.e., without performing makeinstall), they will have to first adjust BROPATH to look for scripts and additional files inside the build directory. Sourcing either build/bro-path-dev.sh or build/bro-path-dev.csh as appropriate for the current shell accomplishes this and also augments your PATH so you can use the Bro binary directly:
Linux Malware Detect (LMD), also known as Maldet, is a malware scanner for Linux released under the GNU GPLv2 license. It is particularly effective for the detection of php backdoors, darkmailers and many other malicious files that can be uploaded on a compromised website. It will help you do detect infected websites and clean the infection, however securing the compromised user or website is still necessary to avoid re-infection.
If the server has cPanel , we recommend you install ClamAV first, as maldet will use the ClamAV scan engine.
You will need to be logged in as root to the server over SSH.
1 – Install maldet
cd /usr/local/src/ && wget http://www.rfxn.com/downloads/maldetect-current.tar.gz && tar -xzvf maldetect-current.tar.gz && cd maldetect-* && sh install.sh
This will automatically install a cronjob inside /etc/cron.daily/maldet so a daily scan will be run for local cPanel or Plesk accounts.
2 – Make sure to update to the latest version and virus signatures:
maldet -d && maldet -u
3 – Run the first scan manually
To scan a specific user’s home directory, run the following command:
maldet -a /home/user
To launch a background scan for all user’s public_html and public_ftp in all home directories, run the following command:
maldet -b –scan-all /home?/?/public_?
(We also recommend you to scan /tmp and /dev/shm/)
4 – Verify the scan report
We recommend you to always read the scan reports before doing a quarantine. You will also be able to identify infected websites for further actions.
List all scan reports time and SCANID:
maldet –report list
Show a specific report details :
maldet –report SCANID
Show all scan details from log file:
grep “{scan}” /usr/local/maldetect/event_log
5 – Clean the malicious files
By default the quarantine is disabled. You will have to launch it manually.
Please review these configuration variables in /usr/local/maldetect/conf.maldet
variable value description
quar_hits number if the number is different than 0, enables automatic quarantine
Maldet can send you and email alert each time it detects malware. Please review these configuration variables in /usr/local/maldetect/conf.maldet
variable value description
email_alert 1 or 0 enable or disable e-mail alerts
email_addr e-mail address target e-mail for notifications, should be put in quotes like: “myuser@mydomain.com”
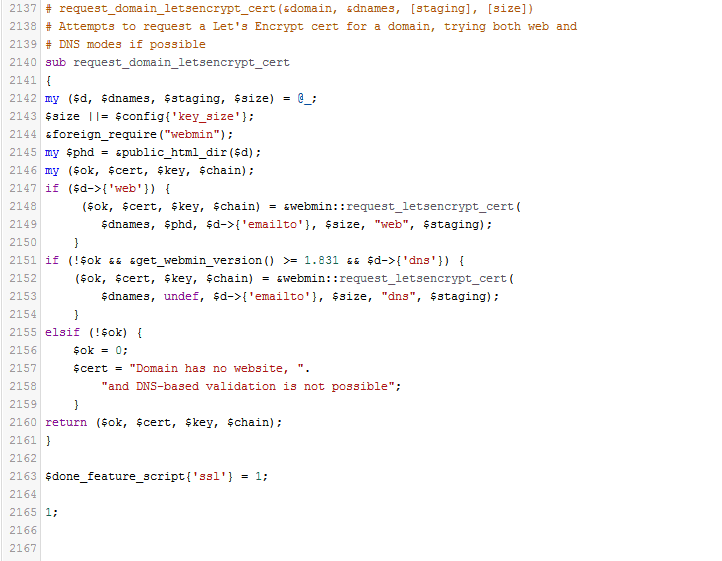
Let’s Encrypt is a free, automated, and open certificate authority (CA), run for the public’s benefit. It is a service provided by the Internet Security Research Group (ISRG)
We give people the digital certificates they need in order to enable HTTPS (SSL/TLS) for websites, for free, in the most user-friendly way we can. We do this because we want to create a more secure and privacy-respecting Web.
The key principles behind Let’s Encrypt are:
Free: Anyone who owns a domain name can use Let’s Encrypt to obtain a trusted certificate at zero cost.
Automatic: Software running on a web server can interact with Let’s Encrypt to painlessly obtain a certificate, securely configure it for use, and automatically take care of renewal.
Secure: Let’s Encrypt will serve as a platform for advancing TLS security best practices, both on the CA side and by helping site operators properly secure their servers.
Transparent: All certificates issued or revoked will be publicly recorded and available for anyone to inspect.
Open: The automatic issuance and renewal protocol will be published as an open standard that others can adopt.
Cooperative: Much like the underlying Internet protocols themselves, Let’s Encrypt is a joint effort to benefit the community, beyond the control of any one organization.
StarWind Virtual SAN Free targets those who need a SAN or NAS for their home lab, educational or research purposes. It is free for production use, but comes with a basic restricted set of features, compared to the full VSAN. In case a serious project is starting, StarWind Virtual SAN will come in handy. It offers a wider set of features unlocked and more usage scenarios, also being backed by StarWind support. Getting qualified assistance from expert engineers simplifies the building and maintenance of virtualization infrastructure. The complete list of differences between free and paid versions can be found here. In case there is no time for “Do-It-Yourself” tinkering, StarWind offers a turnkey solution – StarWind HyperConverged Appliance. It unifies best-of-breed software and hardware from multiple vendors and covers it with one “support umbrella”.