onfigure EPEL repo to download the latest Monit package.
[root@server ~]# rpm -ivh https://dl.fedoraproject.org/pub/epel/epel-release-latest-7.noarch.rpm |
Install the Monit.
[root@server ~]# yum -y install monit |
Start monit by using the following command.
[root@server ~]# monit |
Check the monit status.
[root@server ~]# monit status The Monit daemon 5.6 uptime: 0m System 'server.itzgeek.com' status Running monitoring status Monitored load average [0.14] [0.55] [0.49] cpu 0.0%us 0.0%sy 0.0%wa memory usage 390704 kB [20.8%] swap usage 0 kB [0.0%] data collected Wed, 23 Jul 2014 16:06:28 |
Configure Monit:
Monit config file is /etc/monit.conf, by default monit is set to check the services at interval of 1 min, this setting can be altered by changing.
[root@server ~]# vi /etc/monitrc set daemon 60 |
Alert cans be configured by.
set mailserver |
Alert templates can be found in the configuration file itself.
Logs setting can be changed by using the following file.
[root@server ~]# vi /etc/monit.d/logging set logfile |
Web Interface:
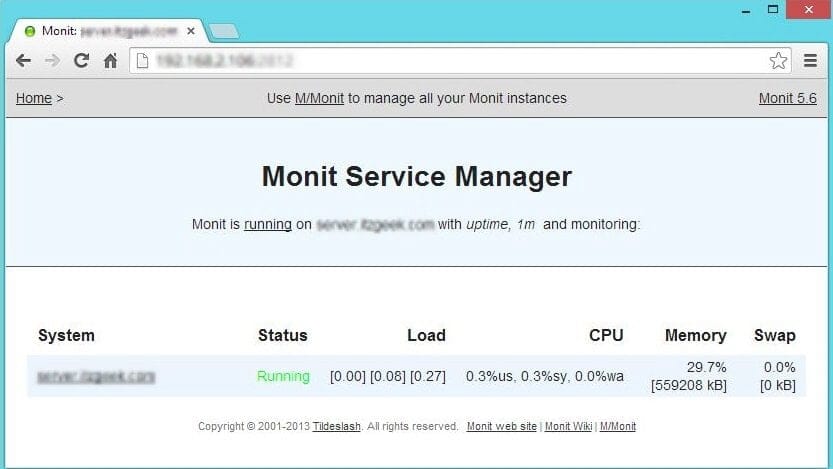
Monit also provides a web interface to monitor and manage the configured services, by default monit listens on 2812 port but it needs to be setup. Open monit configuration file /etc/monit.conf.
[root@server ~]# vi /etc/monit.conf |
Look for httpd port 2812, modify the following entries
FROM
set httpd port 2812 and use address localhost # only accept connection from localhost allow localhost # allow localhost to connect to the server and allow admin:monit # require user 'admin' with password 'monit' allow @monit # allow users of group 'monit' to connect (rw) allow @users readonly # allow users of group 'users' to connect readonly |
TO
set httpd port 2812 allow 0.0.0.0/0.0.0.0 allow admin:monit |
From the above settings, monit will listen on 2812; admin user will able to access the web interface from any network.
Reload monit.
[root@server ~]# systemctl restart monit.service |
Auto start Monit on start-up.
[root@server ~]# systemctl enable monit.service |

Configuring services for monitoring:
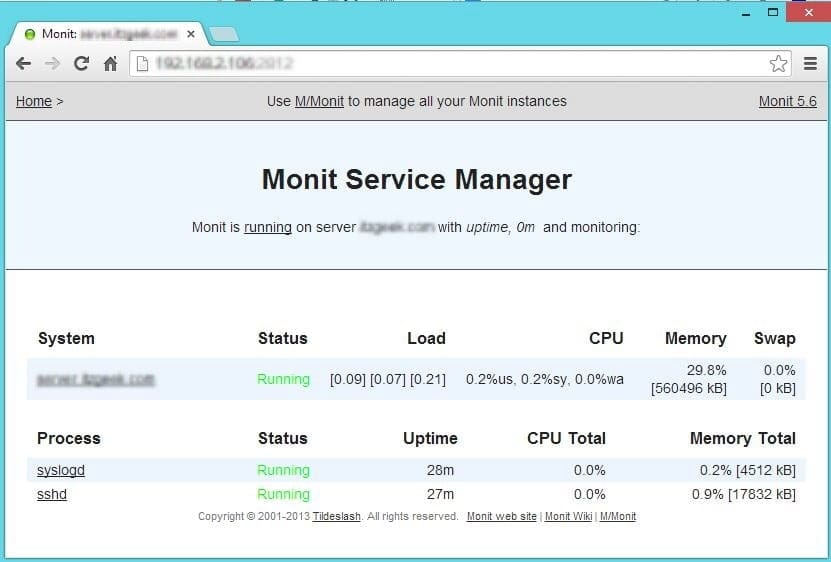
Once the web interface is up, we can start to setup other services that you want to monitor; you can place the configuration files under /etc/monit.d/ directory.
Configure for sshd
[root@server ~]# vi /etc/monit.d/sshdmonitor check process sshd with pidfile /var/run/sshd.pid start program "/usr/bin/systemctl start sshd.service" stop program "/usr/bin/systemctl stop sshd.service" if failed port 22 protocol ssh then restart |
Configure for syslog
[root@server ~]# vi /etc/monit.d/syslogmonitor check process syslogd with pidfile /var/run/syslogd.pid start program = "/usr/bin/systemctl start rsyslog.service" stop program = "/usr/bin/systemctl stop rsyslog.service" |
Once configured, test the monit syntax
[root@server ~]# monit -t Control file syntax OK |
Reload it, to take effect of changes
[root@server ~]# monit reload |

Test the Monitoring:
Now stop the syslog daemon
[root@server ~]# /etc/init.d/rsyslog stop |
Wait for 30 second, monit will start the syslog automatically. You can find it in monit log.
[root@server ~]# cat /var/log/monit [EDT Jul 23 16:28:04] error : 'syslogd' process is not running [EDT Jul 23 16:28:04] info : 'syslogd' trying to restart [EDT Jul 23 16:28:04] info : 'syslogd' start: /usr/bin/systemctl [EDT Jul 23 16:29:04] info : 'syslogd' process is running with pid 40440 |
That’s All, We have successfully configured Monit on CentOS
