If someone is having the same problem,
I solved it by enabling LF_IPSET in csf.conf
😉
# systemctl restart csf
If someone is having the same problem,
I solved it by enabling LF_IPSET in csf.conf
😉
# systemctl restart csf
If you want to redirect HTTP to HTTPS and want to add www with each URL, use the htaccess below:
RewriteEngine On
RewriteCond %{HTTPS} off
RewriteRule (.*) https://%{HTTP_HOST}%{REQUEST_URI} [R,L]
RewriteCond %{HTTP_HOST} !^www\.
RewriteRule ^(.*)$ https://www.%{HTTP_HOST}/$1 [R=301,L]
It will first redirect HTTP to HTTPS and then it will redirect to https://www
😉
My friend ran into a problem with my CENTOS Server. The problem was related to a error in Opencart.
“Error 413 Request Entity is Too Large…”
You need to edit mod_security.conf to fix this issue
/etc/httpd/conf.d/mod_security.conf
Locate this part near the top of the configuration
# Default recommended configuration
SecRuleEngine On “You may turn this Off, until you fix thing, but put it back On“
SecRequestBodyAccess On
SecRule REQUEST_HEADERS:Content-Type “text/xml” \
“id:’200000′,phase:1,t:none,t:lowercase,pass,nolog,ctl:requestBodyProcessor=XML”
SecRequestBodyLimit 531072
SecRequestBodyNoFilesLimit 531072
SecRequestBodyInMemoryLimit 531072
SecRequestBodyLimitAction Reject
Now change the value of those two configuration
SecRequestBodyLimit 2147483647 (2GB unlimited value)
SecRequestBodyNoFilesLimit 5242880 (This will fix the 413 error)
SecRequestBodyInMemoryLimit 531072
SecRequestBodyLimitAction Reject
Restart Apache
systemctl restart httpd
ENJOY!
Cheers Dejan from SERBIA! TEAMWORK!!! ![]()

onfigure EPEL repo to download the latest Monit package.
[root@server ~]# rpm -ivh https://dl.fedoraproject.org/pub/epel/epel-release-latest-7.noarch.rpm |
Install the Monit.
[root@server ~]# yum -y install monit |
Start monit by using the following command.
[root@server ~]# monit |
Check the monit status.
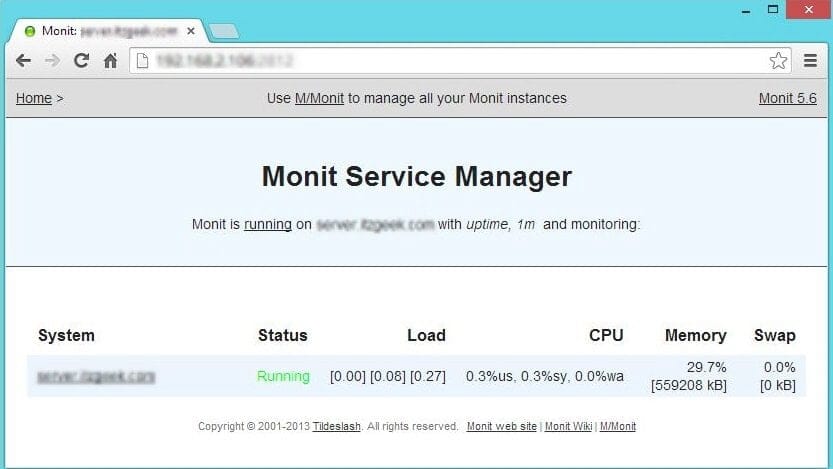
[root@server ~]# monit status The Monit daemon 5.6 uptime: 0m System 'server.itzgeek.com' status Running monitoring status Monitored load average [0.14] [0.55] [0.49] cpu 0.0%us 0.0%sy 0.0%wa memory usage 390704 kB [20.8%] swap usage 0 kB [0.0%] data collected Wed, 23 Jul 2014 16:06:28 |
Monit config file is /etc/monit.conf, by default monit is set to check the services at interval of 1 min, this setting can be altered by changing.
[root@server ~]# vi /etc/monitrc set daemon 60 |
Alert cans be configured by.
set mailserver |
Alert templates can be found in the configuration file itself.
Logs setting can be changed by using the following file.
[root@server ~]# vi /etc/monit.d/logging set logfile |
Monit also provides a web interface to monitor and manage the configured services, by default monit listens on 2812 port but it needs to be setup. Open monit configuration file /etc/monit.conf.
[root@server ~]# vi /etc/monit.conf |
Look for httpd port 2812, modify the following entries
FROM
set httpd port 2812 and use address localhost # only accept connection from localhost allow localhost # allow localhost to connect to the server and allow admin:monit # require user 'admin' with password 'monit' allow @monit # allow users of group 'monit' to connect (rw) allow @users readonly # allow users of group 'users' to connect readonly |
TO
set httpd port 2812 allow 0.0.0.0/0.0.0.0 allow admin:monit |
From the above settings, monit will listen on 2812; admin user will able to access the web interface from any network.
Reload monit.
[root@server ~]# systemctl restart monit.service |
Auto start Monit on start-up.
[root@server ~]# systemctl enable monit.service |
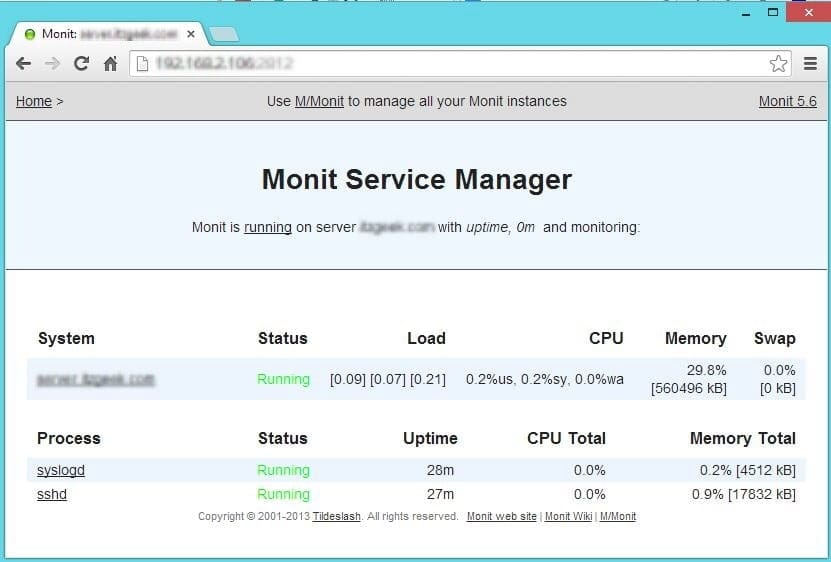
Once the web interface is up, we can start to setup other services that you want to monitor; you can place the configuration files under /etc/monit.d/ directory.
Configure for sshd
[root@server ~]# vi /etc/monit.d/sshdmonitor check process sshd with pidfile /var/run/sshd.pid start program "/usr/bin/systemctl start sshd.service" stop program "/usr/bin/systemctl stop sshd.service" if failed port 22 protocol ssh then restart |
Configure for syslog
[root@server ~]# vi /etc/monit.d/syslogmonitor check process syslogd with pidfile /var/run/syslogd.pid start program = "/usr/bin/systemctl start rsyslog.service" stop program = "/usr/bin/systemctl stop rsyslog.service" |
Once configured, test the monit syntax
[root@server ~]# monit -t Control file syntax OK |
Reload it, to take effect of changes
[root@server ~]# monit reload |
Now stop the syslog daemon
[root@server ~]# /etc/init.d/rsyslog stop |
Wait for 30 second, monit will start the syslog automatically. You can find it in monit log.
[root@server ~]# cat /var/log/monit [EDT Jul 23 16:28:04] error : 'syslogd' process is not running [EDT Jul 23 16:28:04] info : 'syslogd' trying to restart [EDT Jul 23 16:28:04] info : 'syslogd' start: /usr/bin/systemctl [EDT Jul 23 16:29:04] info : 'syslogd' process is running with pid 40440 |
That’s All, We have successfully configured Monit on CentOS
This section will cover how to install Nagios 4 on your monitoring server. You only need to complete this section once.
Because we are building Nagios Core from source, we must install a few development libraries that will allow us to complete the build.
First, install the required packages:
sudo yum install gcc glibc glibc-common gd gd-devel make net-snmp openssl-devel xinetd unzip
We must create a user and group that will run the Nagios process. Create a “nagios” user and “nagcmd” group, then add the user to the group with these commands:
sudo useradd nagios
sudo groupadd nagcmd
sudo usermod -a -G nagcmd nagios
Let’s install Nagios now.
Download the source code for the latest stable release of Nagios Core. Go to the Nagios downloads page, and click the Skip to download link below the form. Copy the link address for the latest stable release so you can download it to your Nagios server.
At the time of this writing, the latest stable release is Nagios 4.1.1. Download it to your home directory with curl:
cd ~
curl -L -O https://assets.nagios.com/downloads/nagioscore/releases/nagios-4.1.1.tar.gz
Extract the Nagios archive with this command:
tar xvf nagios-*.tar.gz
Then change to the extracted directory:
cd nagios-*
Before building Nagios, we must configure it with this command:
./configure --with-command-group=nagcmd
Now compile Nagios with this command:
make all
Now we can run these make commands to install Nagios, init scripts, and sample configuration files:
sudo make install
sudo make install-commandmode
sudo make install-init
sudo make install-config
sudo make install-webconf
In order to issue external commands via the web interface to Nagios, we must add the web server user, apache, to the nagcmd group:
sudo usermod -G nagcmd apachFind the latest release of Nagios Plugins here: Nagios Plugins Download. Copy the link address for the latest version, and copy the link address so you can download it to your Nagios server.
At the time of this writing, the latest version is Nagios Plugins 2.1.1. Download it to your home directory with curl:
cd ~
curl -L -O http://nagios-plugins.org/download/nagios-plugins-2.1.1.tar.gz
Extract Nagios Plugins archive with this command:
tar xvf nagios-plugins-*.tar.gz
Then change to the extracted directory:
cd nagios-plugins-*
Before building Nagios Plugins, we must configure it. Use this command:
./configure --with-nagios-user=nagios --with-nagios-group=nagios --with-openssl
Now compile Nagios Plugins with this command:
make
Then install it with this command:
sudo make install
Find the source code for the latest stable release of NRPE at the NRPE downloads page. Download the latest version to your Nagios server.
At the time of this writing, the latest release is 2.15. Download it to your home directory with curl:
Extract the NRPE archive with this command:
Then change to the extracted directory:
Configure NRPE with these commands:
Now build and install NRPE and its xinetd startup script with these commands:
Open the xinetd startup script in an editor:
Modify the only_from line by adding the private IP address of the your Nagios server to the end (substitute in the actual IP address of your server):
only_from = 127.0.0.1 10.132.224.168
Save and exit. Only the Nagios server will be allowed to communicate with NRPE.
Restart the xinetd service to start NRPE:
Now that Nagios 4 is installed, we need to configure it.
Now let’s perform the initial Nagios configuration. You only need to perform this section once, on your Nagios server.
Open the main Nagios configuration file in your favorite text editor. We’ll use vi to edit the file:
sudo vi /usr/local/nagios/etc/nagios.cfg
Now find an uncomment this line by deleting the #:
#cfg_dir=/usr/local/nagios/etc/servers
Save and exit.
Now create the directory that will store the configuration file for each server that you will monitor:
sudo mkdir /usr/local/nagios/etc/servers
Open the Nagios contacts configuration in your favorite text editor. We’ll use vi to edit the file:
sudo vi /usr/local/nagios/etc/objects/contacts.cfg
Find the email directive, and replace its value (the highlighted part) with your own email address:
email nagios@localhost ; <<***** CHANGE THIS TO YOUR EMAIL ADDRESS ******
Save and exit.
Let’s add a new command to our Nagios configuration:
Add the following to the end of the file:
define command{
        command_name check_nrpe
        command_line $USER1$/check_nrpe -H $HOSTADDRESS$ -c $ARG1$
}
Save and exit. This allows you to use the check_nrpe command in your Nagios service definitions.
Use htpasswd to create an admin user, called “nagiosadmin”, that can access the Nagios web interface:
sudo htpasswd -c /usr/local/nagios/etc/htpasswd.users nagiosadmin
Enter a password at the prompt. Remember this login, as you will need it to access the Nagios web interface.
Note: If you create a user that is not named “nagiosadmin”, you will need to edit /usr/local/nagios/etc/cgi.cfg and change all the “nagiosadmin” references to the user you created.
Nagios is ready to be started. Let’s do that, and restart Apache:
sudo systemctl start nagios.service
sudo systemctl restart httpd.service
To enable Nagios to start on server boot, run this command:
sudo chkconfig nagios on
If you want to restrict the IP addresses that can access the Nagios web interface, you will want to edit the Apache configuration file:
sudo vi /etc/httpd/conf.d/nagios.conf
Find and comment the following two lines by adding # symbols in front of them:
Order allow,deny
Allow from all
Then uncomment the following lines, by deleting the # symbols, and add the IP addresses or ranges (space delimited) that you want to allow to in the Allow from line:
#  Order deny,allow
#  Deny from all
#  Allow from 127.0.0.1
As these lines will appear twice in the configuration file, so you will need to perform these steps once more.
Save and exit.
Now start Nagios and restart Apache to put the change into effect:
sudo systemctl restart nagios.service
sudo systemctl restart httpd.service
Nagios is now running, so let’s try and log in.
Open your favorite web browser, and go to your Nagios server (substitute the IP address or hostname for the highlighted part):
http://nagios_server_public_ip/nagios
Because we configured Apache to use htpasswd, you must enter the login credentials that you created earlier. We used “nagiosadmin” as the username:
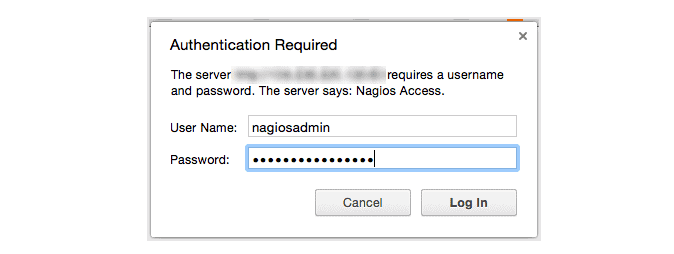
After authenticating, you will be see the default Nagios home page. Click on the Hosts link, in the left navigation bar, to see which hosts Nagios is monitoring:
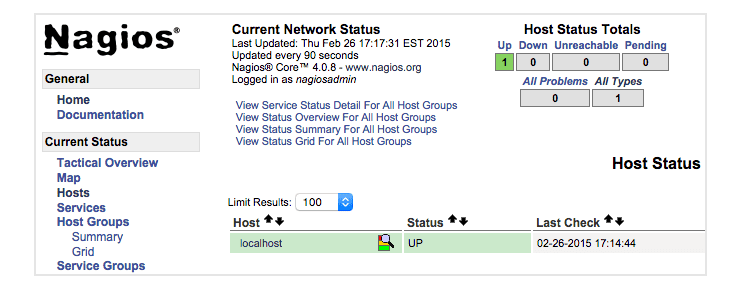
As you can see, Nagios is monitoring only “localhost”, or itself.
Let’s monitor another host with Nagios!
In this section, we’ll show you how to add a new host to Nagios, so it will be monitored. Repeat this section for each CentOS or RHEL server you wish to monitor.
Note: If you want to monitor an Ubuntu or Debian server, follow the instructions in this link: Monitor an Ubuntu Host with NRPE.
On a server that you want to monitor, install the EPEL repository:
sudo yum install epel-release
Now install Nagios Plugins and NRPE:
sudo yum install nrpe nagios-plugins-all
Now, let’s update the NRPE configuration file. Open it in your favorite editor (we’re using vi):
sudo vi /etc/nagios/nrpe.cfg
Find the allowed_hosts directive, and add the private IP address of your Nagios server to the comma-delimited list (substitute it in place of the highlighted example):
allowed_hosts=127.0.0.1,10.132.224.168
Save and exit. This configures NRPE to accept requests from your Nagios server, via its private IP address.
Restart NRPE to put the change into effect:
sudo systemctl start nrpe.service
sudo systemctl enable nrpe.service
Once you are done installing and configuring NRPE on the hosts that you want to monitor, you will have to add these hosts to your Nagios server configuration before it will start monitoring them.
On your Nagios server, create a new configuration file for each of the remote hosts that you want to monitor in /usr/local/nagios/etc/servers/. Replace the highlighted word, “yourhost”, with the name of your host:
sudo vi /usr/local/nagios/etc/servers/yourhost.cfg
Add in the following host definition, replacing the host_name value with your remote hostname (“web-1” in the example), the alias value with a description of the host, and the address value with the private IP address of the remote host:
define host {
        use                             linux-server
        host_name                       yourhost
        alias                           My first Apache server
        address                         10.132.234.52
        max_check_attempts              5
        check_period                    24x7
        notification_interval           30
        notification_period             24x7
}
With the configuration file above, Nagios will only monitor if the host is up or down. If this is sufficient for you, save and exit then restart Nagios. If you want to monitor particular services, read on.
Add any of these service blocks for services you want to monitor. Note that the value of check_command determines what will be monitored, including status threshold values. Here are some examples that you can add to your host’s configuration file:
Ping:
define service {
        use                             generic-service
        host_name                       yourhost
        service_description             PING
        check_command                   check_ping!100.0,20%!500.0,60%
}
SSH (notifications_enabled set to 0 disables notifications for a service):
define service {
        use                             generic-service
        host_name                       yourhost
        service_description             SSH
        check_command                   check_ssh
        notifications_enabled           0
}
If you’re not sure what use generic-service means, it is simply inheriting the values of a service template called “generic-service” that is defined by default.
Now save and quit. Reload your Nagios configuration to put any changes into effect:
sudo systemctl reload nagios.service
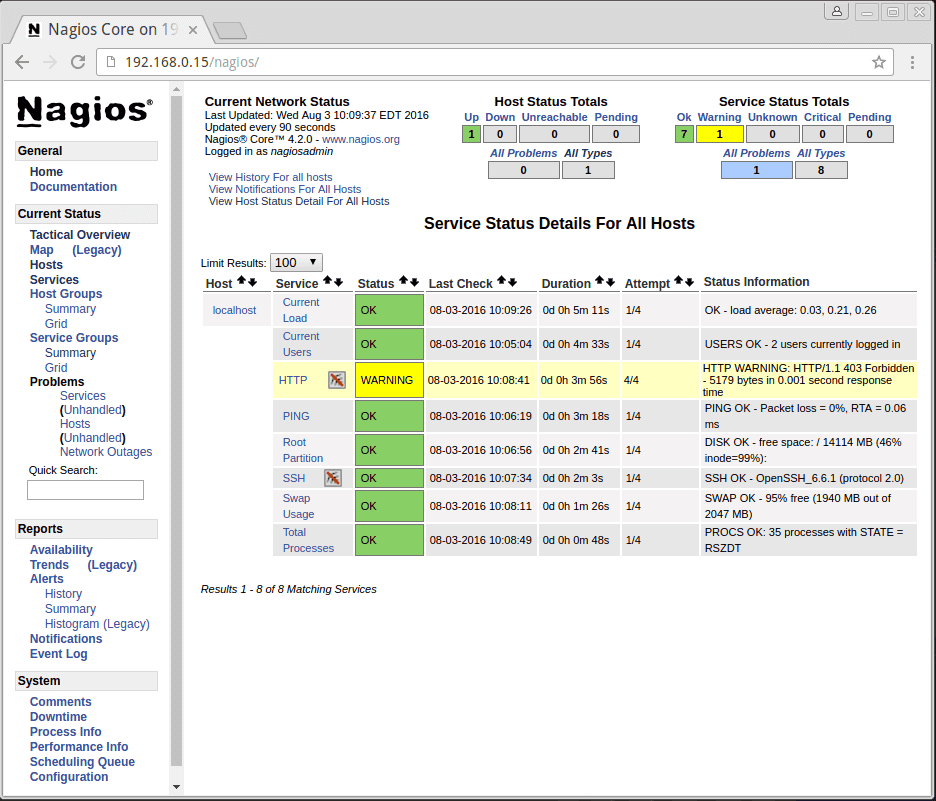
Once you are done configuring Nagios to monitor all of your remote hosts, you should be set. Be sure to access your Nagios web interface, and check out the Services page to see all of your monitored hosts and services:
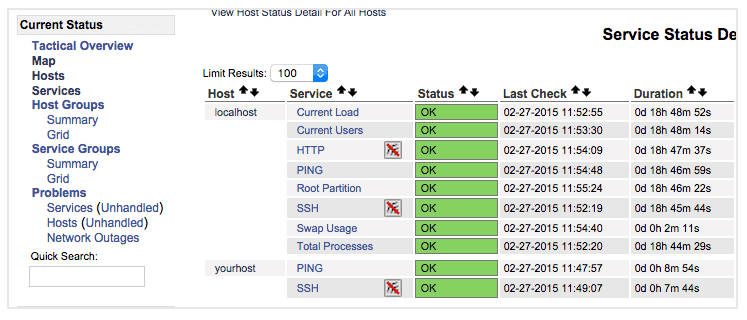
Have fun!

CentOS has received a new update that fixes important kernel vulnerabilities. The update has been specifically designed for systems running on CentOS 7.
Johnny Hughes, the maintainer of CentOS, has published a security advisory detailing the five vulnerabilities addressed by the latest update. Hughes highlights that the update fixes a remote code execution vulnerability (CVE-2017-7477). The vulnerability could allow remote attackers escalate privileges by allocating heap memory in Linux kernel to build the scatter gather list from fragment list in the socket buffer.
Another remote code execution vulnerability (CVE-2017-7645) has been patched in the update. The vulnerability affected NFS2/3 RPC client that could let users send long arguments to the NFS server and let an attacker crash the kernel.
Third important vulnerability (CVE-2017-7895) patched in this security release was discovered in NFSv2 and NFSv3 server implementations. Another vulnerability (CVE-2017-2583) was found in virtual machine support in the kernel while the last important security flaw (CVE-2017-6214) was found in the kernel’s packet handling with URG flags. A remote attacker could force the kernel to enter an infinite loop using this vulnerability.
The CentOS maintainer has pushed the update kernel-3.10.0-514.26.1.el7 in the stable repository of the OS. All the CentOS 7 users are recommended to update their systems immediately.
Running a CentOS Server with Webmin and Virtualmin,
# could not create directory
In Virtualmin select the domain name that have a problem and go change the Enable safe mode in /Virtualmin/Services/PHP Configuration
Disable safe mode!
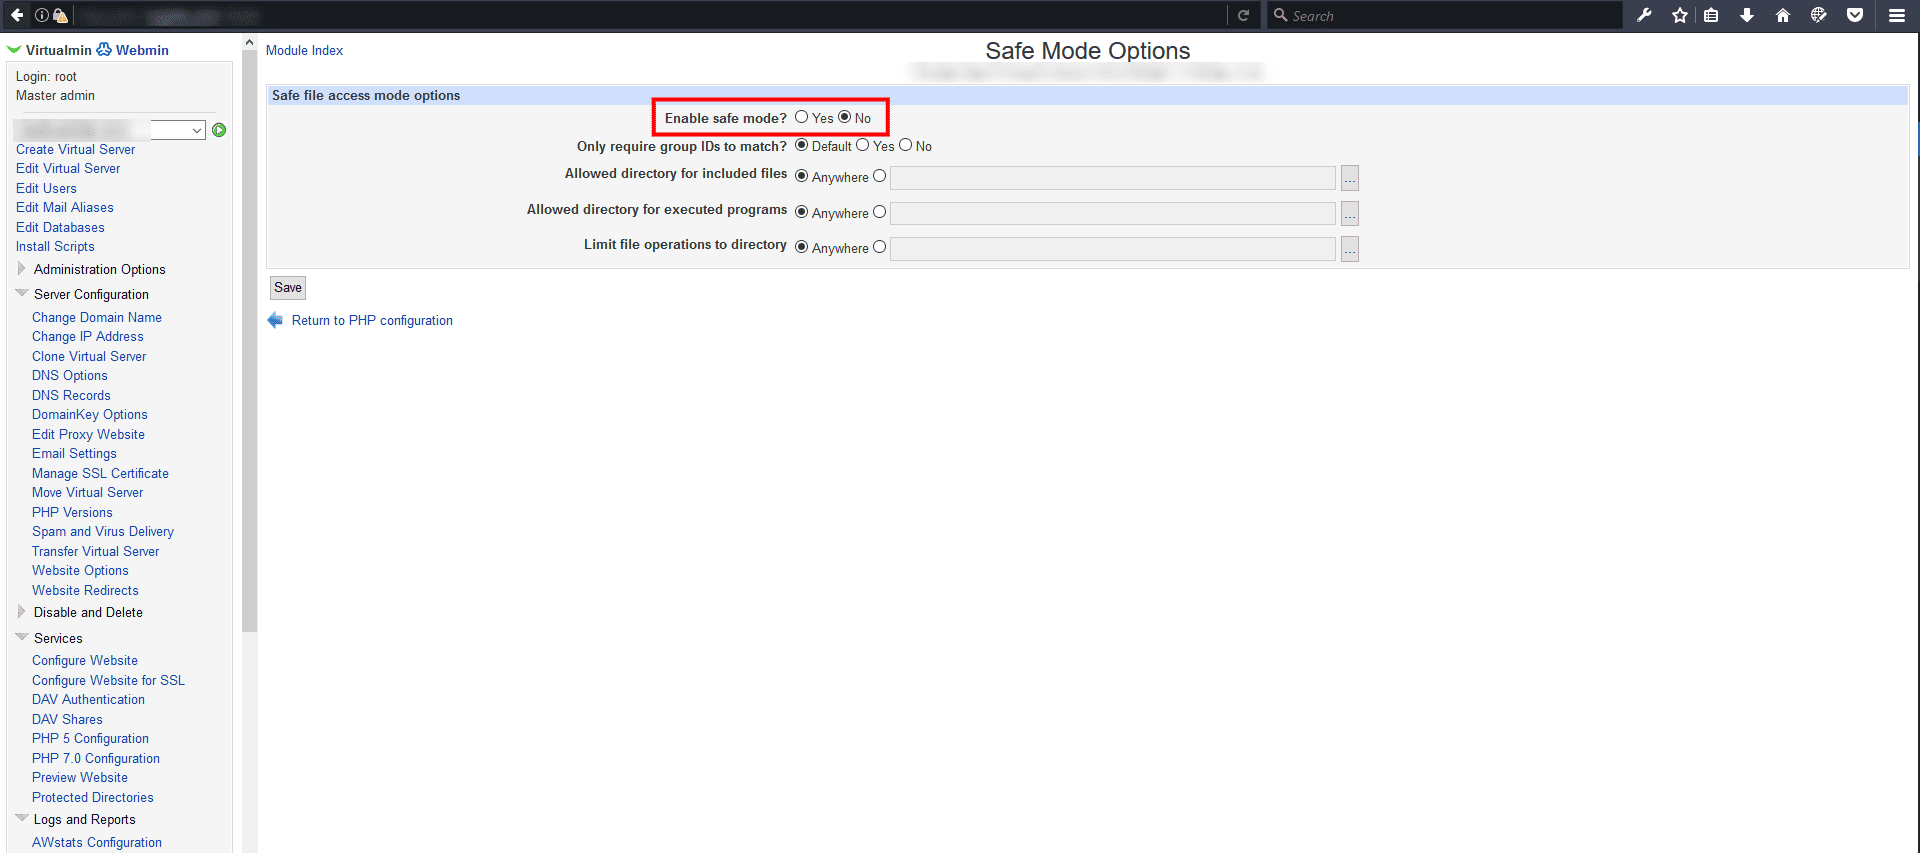
Also there is other stuff to look for…
😉
# Controls the System Request debugging functionality of the kernel
kernel.sysrq = 0
# Controls whether core dumps will append the PID to the core filename.
# Useful for debugging multi-threaded applications.
kernel.core_uses_pid = 1
#Prevent SYN attack
net.ipv4.tcp_syncookies = 1
net.ipv4.tcp_max_syn_backlog = 2048
net.ipv4.tcp_synack_retries = 2
# Disables IP source routing
net.ipv4.conf.lo.accept_source_route = 0
net.ipv4.conf.eth0.accept_source_route = 0
net.ipv4.conf.default.accept_source_route = 0
# Enable IP spoofing protection, turn on source route verification
net.ipv4.conf.eth0.rp_filter = 1
# Disable ICMP Redirect Acceptance
net.ipv4.conf.lo.accept_redirects = 0
net.ipv4.conf.eth0.accept_redirects = 0
net.ipv4.conf.default.accept_redirects = 0
# Enable Log Spoofed Packets, Source Routed Packets, Redirect Packets
net.ipv4.conf.lo.log_martians = 1
net.ipv4.conf.eth0.log_martians = 1
# Disables IP source routing
net.ipv4.conf.lo.accept_source_route = 0
net.ipv4.conf.eth0.accept_source_route = 0
net.ipv4.conf.default.accept_source_route = 0
# Enable IP spoofing protection, turn on source route verification
net.ipv4.conf.eth0.rp_filter = 1
# Disable ICMP Redirect Acceptance
net.ipv4.conf.lo.accept_redirects = 0
net.ipv4.conf.eth0.accept_redirects = 0
net.ipv4.conf.default.accept_redirects = 0
# Modify system limits for Ensim WEBppliance
fs.file-max = 65000
# Decrease the time default value for tcp_fin_timeout connection
net.ipv4.tcp_fin_timeout = 15
# Decrease the time default value for tcp_keepalive_time connection
net.ipv4.tcp_keepalive_time = 1800
# Turn off the tcp_window_scaling
net.ipv4.tcp_window_scaling = 0
# Turn off the tcp_sack ( Need to turn on for traffic to internet)
#net.ipv4.tcp_sack = 0
# Turn off the tcp_timestamps
net.ipv4.tcp_timestamps = 0
# Enable TCP SYN Cookie Protection
net.ipv4.tcp_syncookies = 1
# Set maximum amount of memory allocated to shm to 256MB
kernel.shmmax = 268435456
# Increase the maximum total TCP buffer-space allocatable
net.ipv4.tcp_mem = 57344 57344 65536
# Increase the maximum TCP write-buffer-space allocatable
net.ipv4.tcp_wmem = 32768 65536 524288
# Increase the maximum TCP read-buffer space allocatable
net.ipv4.tcp_rmem = 98304 196608 1572864
# Increase the maximum and default receive socket buffer size
net.core.rmem_max = 524280
net.core.rmem_default = 524280
# Increase the maximum and default send socket buffer size
net.core.wmem_max = 524280
net.core.wmem_default = 524280
# Increase the tcp-time-wait buckets pool size
net.ipv4.tcp_max_tw_buckets = 1440000
# Allowed local port range
net.ipv4.ip_local_port_range = 16384 65536
# Increase the maximum memory used to reassemble IP fragments
net.ipv4.ipfrag_high_thresh = 512000
net.ipv4.ipfrag_low_thresh = 446464
# Increase the maximum amount of option memory buffers
net.core.optmem_max = 57344
Linux do crash. It is not so frequent, but it happens. You know what to do when an application refuses to obey, but if everything fails, the last solution is using the supreme power on Linux: the magic SysRq key. By using this key with a combination of “Alt” and another letter, you will be able to make your computer respond no matter what. It was already evoked, but a little explanation does not hurt, and the more you know, the more prepared you will be when facing a real problem. Also, understanding the individual effect is always better than just repeating a combo learned by heart.
As said before, the magic key is super handy. But first, you have to activate this functionality if it is not already done. To check, use the command
cat /proc/sys/kernel/sysrq
If it returns a 1, the Magic Key is working. If it is a 0, you will need to activate it. In most cases, if you want to activate it temporarily, you can try
sudo echo "1" > /proc/sys/kernel/sysrq
But this did not work for me. So under Archlinux, I used instead:
sudo sysctl kernel.sysrq=1
Note that this will be only temporary. If you want the Magic Key to work even after a reboot, the best way is to edit the file “/etc/sysctl.conf”, so that the line
kernel.sysrq = 0
becomes
kernel.sysrq = 1
The whole point of using the Magic SysRq key is to combine it with the “Alt” key and another letter in order to trigger a particular function, even if your computer seems frozen. To begin, you should know that this System Request key is usually sharing its location with the “Print Scrn” key at the top right of your keyboard. Above the “Insert” key, and left to “Scroll Lock.”

As you can guess, the effect of the combination depends on which letter key is used. Here is a non-exhaustive list of letter you can use to obtain an interesting result.
Every Linux user should know these examples. If your X server is frozen and you cannot access any virtual console, using “Alt + SysRq + r” should take the keyboard away from the X server and let you perform “Ctrl + Alt + F1” in order to get to a terminal and kill the appropriate processes.
If you do not have the patience to do that, “Alt + SysRq + k” will kill everything in the same way as “Ctrl + Alt + Backspace” (but more violently).
If nothing responds at all, and the only way is to reboot your computer, the classical combo is “reisub” for “Raising Elephant Is So Utterly Boring”, or just remember the opposite of “busier“. Use each letter of this anagram with the magic key in order to:
The idea is that the magic key combinations are generally super violent. You do not want anybody to use it on your computer while you are not looking. But as a last resort, it can become the ultimate tool. I rarely encountered a situation where SysRq did not respond. So when your Linux does not obey its master, you know what to do.