Author: root
Accessing your USB backup drive on ClearOS
First you will need to locate your USB name
# fdisk -l
After you located your USB drive you will need to check out the partition type
# fdisk -l /dev/sdb
To mount your USB drive run the following commands
# mkdir /mnt/somedir
# mount /dev/sdb1 /mnt/somedir
Now navigate using a ftp client to /mnt/somedir

You will now be able to download your ClearOS baremetal backup files to a secure place! When finished just umount your USB drive

# umount /dev/sdb1
After you run the umount command you will see your baremetal backup again!

Enjoy!
SimpleWall Protection Firewall
Wonderful Dashboard
Simplewall helps you keep track of all the key aspects of your network including alerts on a simple and easy to understand Dashboard with everything you need to know.

End to End Network Protection
With Simplewall, you get comprehensive intrusion protection, virus protection, spam prevention and a lot more bundled in, so you get the peace of mind you need.

Super Cool Content Filtering
Simplewall makes it dead easy for you to manage the content policies on your network and set it by users, group, time slots and a lot more.

Download it now!
;-)
Hello world!

H A P P Y H O L I D A Y ‘ S
Cannot install WordPress plugin update – FTP Error
I ran into a problem when trying to update plugin in a fresh installed wordpress on a ClearOS Box! 😉
So I got it working by doing this and then ran this:
chown -R apache:apache /var/www
find /var/www/ -type d -exec chmod 755 {} \;
find /var/www/ -type f -exec chmod 644 {} \;
All working good now.
Optional : Add define(‘FSMETHOD’, ‘direct’); in wp-config.php
Not recommended for obvious Security issues!
OLD NOTES : as long as you have one (1) site apache is Ok, but when you have more sites you should never give them the same user, regardless if using the direct FS_METHOD in your wp-config or not. Why? If one site is hacked all others will be too.
We are in a Virtual Server Era now… will investigate this!
Enjoy!
Let’s Encrypt available on CLEAROS ;-)

Let’s Encrypt is an open certificate authority that provides free SSL certificates. The app intelligently integrates the certificate lifecyle and management into Webconfig to be used by other services – Webconfig, website hosting, Openfire, OpenVPN etc…
NOTE : You need to install the webserver to be able to obtain a free Let’s Encrypt Certificate!
How do I use Let’s Encrypt on port 81?

Simple, after you installed the webserver and requested a SSL key from Let’s Encrypt the next step is to use the SSL Key for the webconfig that use port 81.
Navigate to /System/Settings/General Settings
In the SSL Certificate select your new Let’s Encrypt Key
Click Update

Enjoy!
Kernel ACPI Error SMBus/IPMI/GenericSerialBus
I found the next error message in the CSF log
ACPI Error: SMBus/IPMI/GenericSerialBus write requires Buffer of length 66, found length 32 (20130517/exfield-389)

Dec 15 10:48:57 srv kernel: ACPI Error: SMBus/IPMI/GenericSerialBus write requires Buffer of length 66, found length 32 (20130517/exfield-299) Dec 15 10:48:57 srv kernel: ACPI Error: Method parse/execution failed [\_SB_.PMI0._PMM] (Node ffff88042949d960), AE_AML_BUFFER_LIMIT (20130517/psparse-536) Dec 15 10:48:57 srv kernel: ACPI Exception: AE_AML_BUFFER_LIMIT, Evaluating _PMM (20130517/power_meter-339) |
The message is generated every 5 minutes when lm-sensors try to read the values from the power meter sensor(s). HP has ignored the spec for this method and the result is the error shown above.
The problem can be solved on two ways:
– you can ignore this message (it is safely to ignore)
– you can skip the power meter sensors (at least until someone fix this)
Since I already have the latest firmware, I can’t suggest the firmware update (at least for gen 6, 7 and gen8 servers).
To reproduce the problem just find the file power1_average and try to read it
find /sys/devices/LNXSYSTM\:00/ |grep ACPI000D |
In my case the file is located in /sys/devices/LNXSYSTM:00/device:00/ACPI000D:00/
Read the file
cat /sys/devices/LNXSYSTM:00/device:00/ACPI000D:00/power1_average |
The result will be probably 0 and the error will be thrown in the log.
To solve the problem check the exact sensor which is affected with:
[root log]# sensors ... power_meter-acpi-0 Adapter: ACPI interface power1: 0.00 W (interval = 300.00 s) .... |
As you can see above, the sensor is power_meter-acpi-0. Now disable the sensor by adding
chip "power_meter-acpi-0"
ignore power1 |
at the end of the /etc/sensors3.conf file.
The reboot is recommended but it is not necessary.
Check the sensor again with
[root log]# sensors ... power_meter-acpi-0 Adapter: ACPI interface .... |
As you can see, the line “power1….” is missing and the log is empty.
Mod_Security ~ HTTP Error when uploading media to WP
Easy temporary fix here!
If you are running a Centos Server locate this file
/etc/httpd/conf.d/mod_security.conf

Rename SecRequestBodyAccess On to SecRequestBodyAccess Off
Apply configuration to APACHE Server

Et voilà!
Happy PC Gamez ~
Snort! pfBlockerNG for pfSense v2.4.x
Notes : Cannot delete virtual server
That seems to be a bug that shows up occasionally, though it’s not reliably reproducible, so it hasn’t been corrected.
The fix is simple though, you can delete the domain ID in “/etc/webmin/virtual-server/domains/”, restart Virtualmin, and then it should be gone from your drop-down list.
https://www.virtualmin.com/node/15222
15078987692871
Setting up log file rotation ..
.. Log file rotation failed! : .. the log file /var/log/virtualmin/xxxxxxxxxxxx_access_log is already being rotated at /usr/libexec/webmin/web-lib-funcs.pl line 1433.
Delete the log files in /var/log/virtualmin
Delete the user in “User and Group” in webmin
Next step : re-create the virtual server!
VirtualMIN Backup Failed – MySQL “MariaDB” crash
Good day! I ran into a problem when backing up all my virtualMIN websites. When the backup failed something stange happened to MySQL “MariaDB” database server. When backup fail, MariaDB crash!
To fix this issue I added a command to run after backup:
systemctl stop mariadb ; systemctl start mariaDB
Located in > VirtualMIN > Scheduled Backups >

This will prevent mariaDB to crash after a failed virtualMIN backup!
Notes: Check the size of your /tmp and increase it!
If you are having “Out of resources Errcode : 24 message”
The mysql error: Out of resources when opening file… (Errcode: 24) indicates that the number of files that msyql is permitted to open has been exceeded.
This limit is controlled by the variable open_files_limit. You can read this in phpMyAdmin (or the MySQL command line utility) with the statement:
To set this variable to a higher number, edit the /etc/my.cnf file and add the lines:
[mysqld] open_files_limit = 5000
Then be sure to restart mysql with: sudo /etc/init.d/mysql restart
Remember to use the server administrative account and sudo when you edit the file. The choice of editor is up to you.
Now, showing the variable should show the number you choose.
Note that 5000 shown above is an example. A good rule of thumb is to take the current number of files and add 1000 to it. If this doesn’t help, add some more. This number affects the amount of memory that MySQL uses, so setting it to a very high number is not a good idea.
You may also verified your /etc/my.cfg configurations:
[mysqld]
datadir = /var/lib/mysql
socket = /var/lib/mysql/mysql.sock
local-infile=0
symbolic-links=0
innodb_file_per_table = 1
thread_concurrency = 8
query_cache_size = 64M
thread_cache_size = 8
myisam_sort_buffer_size = 256M
read_rnd_buffer_size = 32M
read_buffer_size = 4M
sort_buffer_size = 4M
table_open_cache = 512
max_allowed_packet = 7M
key_buffer_size = 512M
open_files_limit = 10000
max_connections = 32768
innodb_buffer_pool_size = 40M
[mysqld_safe]
log-error=/var/log/mariadb/mariadb.log
pid-file=/var/run/mariadb/mariadb.pid
!includedir /etc/my.cnf.d
After modifications you must restart MySQL server
# systemctl restart mariadb
Free Anti-Ransomware Tool

Bitdefender Anti-Ransomware is a free security tool that can protect against existing and emerging ransomware attacks.
Ransomware is a category of malicious software designed to block access to your computer and files until you pay a large sum of money. Download our advanced ransomware vaccine right now to stay safe from losing your money or files.**
Opencart 2.3.0.x Additional Alert Email not saved

Here is a simple fix:
In file ‘admin/view/template/setting/setting.tpl’ replace the line:
<textarea name="config_mail_alert_email" rows="5" placeholder="<?php echo $entry_mail_alert_email; ?>" id="input-alert-email" class="form-control"><?php echo $config_alert_email; ?></textarea>with this one:
<textarea name="config_alert_email" rows="5" placeholder="<?php echo $entry_mail_alert_email; ?>" id="input-alert-email" class="form-control"><?php echo $config_alert_email; ?></textarea>Denied ALL ~ except some IP’S
Order deny,allow
Deny from all
allow from x.x.x.x
allow from x.x.x.xReplace “x” value with the IP you wish to be granted.
Good for a LAB!
Stop Bad Bots Plugin for Wordress (Free)
How to Block and Stop Bad Bots and spiders from stealing you? You can manage the blacklist.
An Internet Bot, also known as web robot, WWW robot or simply bot, spider is a software application that runs automated tasks (scripts) over the Internet. Bad bots consume bandwidth, slow down your server, steal your content and look for vulnerability to compromise your server. Be proactive and Block Bad Bots right away from accessing your server.
- The Stop Bad Bots Free WordPress Plugin is the easiest way to stop Bad Bots and Spiders.
- More than 2500 Bad Bots Included!
- Your Bad Bots Table is always updated with free online automatic updates
- No robots.txt neither .htaccess file requiered
- You Can Add more Bad Bots…
- No DNS Traffic Redirection. No Downtime!
- Easy to manage the list of bad bots
- Easy to set up
- Lightweight
- Save bandwidth.
- Optionally receive an email alert
- Updated On Line Guide
- Start Up Guide
- FAQ Page
- Demo Video
- Free Support Ticket System
- Rated 5 Stars at WordPress
- The Plugin doesn’t block main Google, Yahoo and Bing (Microsoft).
Very light, easy and quick to install (just 2 minutes) and manage.
Poney Telecom Anyone? as12876.net

DNS PORT (53) Flood Detected! Anyone else?>
Here is a list of CIDR,,… to block! 😉
62.210.0.0/16
195.154.0.0/16
212.129.0.0/18
62.4.0.0/19
212.83.128.0/19
212.83.160.0/19
212.47.224.0/19
163.172.0.0/16
51.15.0.0/16
151.115.0.0/16
# 2001:bc8::/32 * Experimental on CSF *
Cheers!
NOTE:
An internet server company Poney Telecom run from France has been at the centre of multiple allegations of organised international criminal activity for over 12 months with all warnings, court summons and legal demands to be closed ignored.
The French service provider facilitates large quantities of spam to a variety of European companies from computers which can be traced back to Russia. These malicious emails should not be opened or responded to as it is common practice to embed viruses within such emails.
Contacting Poney Telecom is far from easy, however when The International‘s legal team finally did make contact they were informed by a member of staff from Poney Telecom that any criminal activity that occurs by using it’s services are “not my problem“. The staff member claiming to be able to speak on behalf of the company went on to state that they had a policy of non-compliance with authorities in or outside of the EU.
As such we advice anyone who receives emails or contact from anybody using a Poney Telecom server IPA to keep a detailed record of all contact that is made via the company. Should sufficient suspicious activity arise contact your local non-emergency police.
Note:
AS4134 – ChinaNet
AS9808 – Guangdong Mobile Com
AS16276 – OVH SAS
AS15003 – Nobis Tech Group
AS36352 – ColoCrossing
AS29761 – QuadraNet
AS15895 – Kyivstar PJSC
AS50915 – S.C. Everhost S.R.L.
AS53889 – Micfo
AS57858 – Fiber Grid OU
*Error*: Unable to check csf due to xtables lock, enable WAITLOCK in csf.conf
If someone is having the same problem,
I solved it by enabling LF_IPSET in csf.conf
😉
# systemctl restart csf
Redirect HTTP to HTTPS in .htaccess
If you want to redirect HTTP to HTTPS and want to add www with each URL, use the htaccess below:
RewriteEngine On
RewriteCond %{HTTPS} off
RewriteRule (.*) https://%{HTTP_HOST}%{REQUEST_URI} [R,L]
RewriteCond %{HTTP_HOST} !^www\.
RewriteRule ^(.*)$ https://www.%{HTTP_HOST}/$1 [R=301,L] It will first redirect HTTP to HTTPS and then it will redirect to https://www
😉
APACHE + MOD_SEC 413 or 44 ~ Request Entity Too Large ;-)
My friend ran into a problem with my CENTOS Server. The problem was related to a error in Opencart.
“Error 413 Request Entity is Too Large…”
You need to edit mod_security.conf to fix this issue
/etc/httpd/conf.d/mod_security.conf
Locate this part near the top of the configuration
# Default recommended configuration
SecRuleEngine On “You may turn this Off, until you fix thing, but put it back On“
SecRequestBodyAccess On
SecRule REQUEST_HEADERS:Content-Type “text/xml” \
“id:’200000′,phase:1,t:none,t:lowercase,pass,nolog,ctl:requestBodyProcessor=XML”
SecRequestBodyLimit 531072
SecRequestBodyNoFilesLimit 531072
SecRequestBodyInMemoryLimit 531072
SecRequestBodyLimitAction Reject
Now change the value of those two configuration
SecRequestBodyLimit 2147483647 (2GB unlimited value)
SecRequestBodyNoFilesLimit 5242880 (This will fix the 413 error)
SecRequestBodyInMemoryLimit 531072
SecRequestBodyLimitAction Reject
Restart Apache
systemctl restart httpd
ENJOY!
Cheers Dejan from SERBIA! TEAMWORK!!! ![]()
Monitoring Linux Systems and Services using Monit

onfigure EPEL repo to download the latest Monit package.
[root@server ~]# rpm -ivh https://dl.fedoraproject.org/pub/epel/epel-release-latest-7.noarch.rpm |
Install the Monit.
[root@server ~]# yum -y install monit |
Start monit by using the following command.
[root@server ~]# monit |
Check the monit status.
[root@server ~]# monit status The Monit daemon 5.6 uptime: 0m System 'server.itzgeek.com' status Running monitoring status Monitored load average [0.14] [0.55] [0.49] cpu 0.0%us 0.0%sy 0.0%wa memory usage 390704 kB [20.8%] swap usage 0 kB [0.0%] data collected Wed, 23 Jul 2014 16:06:28 |
Configure Monit:
Monit config file is /etc/monit.conf, by default monit is set to check the services at interval of 1 min, this setting can be altered by changing.
[root@server ~]# vi /etc/monitrc set daemon 60 |
Alert cans be configured by.
set mailserver |
Alert templates can be found in the configuration file itself.
Logs setting can be changed by using the following file.
[root@server ~]# vi /etc/monit.d/logging set logfile |
Web Interface:
Monit also provides a web interface to monitor and manage the configured services, by default monit listens on 2812 port but it needs to be setup. Open monit configuration file /etc/monit.conf.
[root@server ~]# vi /etc/monit.conf |
Look for httpd port 2812, modify the following entries
FROM
set httpd port 2812 and use address localhost # only accept connection from localhost allow localhost # allow localhost to connect to the server and allow admin:monit # require user 'admin' with password 'monit' allow @monit # allow users of group 'monit' to connect (rw) allow @users readonly # allow users of group 'users' to connect readonly |
TO
set httpd port 2812 allow 0.0.0.0/0.0.0.0 allow admin:monit |
From the above settings, monit will listen on 2812; admin user will able to access the web interface from any network.
Reload monit.
[root@server ~]# systemctl restart monit.service |
Auto start Monit on start-up.
[root@server ~]# systemctl enable monit.service |

Configuring services for monitoring:
Once the web interface is up, we can start to setup other services that you want to monitor; you can place the configuration files under /etc/monit.d/ directory.
Configure for sshd
[root@server ~]# vi /etc/monit.d/sshdmonitor check process sshd with pidfile /var/run/sshd.pid start program "/usr/bin/systemctl start sshd.service" stop program "/usr/bin/systemctl stop sshd.service" if failed port 22 protocol ssh then restart |
Configure for syslog
[root@server ~]# vi /etc/monit.d/syslogmonitor check process syslogd with pidfile /var/run/syslogd.pid start program = "/usr/bin/systemctl start rsyslog.service" stop program = "/usr/bin/systemctl stop rsyslog.service" |
Once configured, test the monit syntax
[root@server ~]# monit -t Control file syntax OK |
Reload it, to take effect of changes
[root@server ~]# monit reload |

Test the Monitoring:
Now stop the syslog daemon
[root@server ~]# /etc/init.d/rsyslog stop |
Wait for 30 second, monit will start the syslog automatically. You can find it in monit log.
[root@server ~]# cat /var/log/monit [EDT Jul 23 16:28:04] error : 'syslogd' process is not running [EDT Jul 23 16:28:04] info : 'syslogd' trying to restart [EDT Jul 23 16:28:04] info : 'syslogd' start: /usr/bin/systemctl [EDT Jul 23 16:29:04] info : 'syslogd' process is running with pid 40440 |
That’s All, We have successfully configured Monit on CentOS
Will try this on a R900 x 4 CPU’S!
How To Install Nagios 4 ! Monitor Your Servers on CentOS 7

Install Nagios 4
This section will cover how to install Nagios 4 on your monitoring server. You only need to complete this section once.
Install Build Dependencies
Because we are building Nagios Core from source, we must install a few development libraries that will allow us to complete the build.
First, install the required packages:
sudo yum install gcc glibc glibc-common gd gd-devel make net-snmp openssl-devel xinetd unzip
Create Nagios User and Group
We must create a user and group that will run the Nagios process. Create a “nagios” user and “nagcmd” group, then add the user to the group with these commands:
sudo useradd nagios
sudo groupadd nagcmd
sudo usermod -a -G nagcmd nagios
Let’s install Nagios now.
Install Nagios Core
Download the source code for the latest stable release of Nagios Core. Go to the Nagios downloads page, and click the Skip to download link below the form. Copy the link address for the latest stable release so you can download it to your Nagios server.
At the time of this writing, the latest stable release is Nagios 4.1.1. Download it to your home directory with curl:
cd ~
curl -L -O https://assets.nagios.com/downloads/nagioscore/releases/nagios-4.1.1.tar.gz
Extract the Nagios archive with this command:
tar xvf nagios-*.tar.gz
Then change to the extracted directory:
cd nagios-*
Before building Nagios, we must configure it with this command:
./configure --with-command-group=nagcmd
Now compile Nagios with this command:
make all
Now we can run these make commands to install Nagios, init scripts, and sample configuration files:
sudo make install
sudo make install-commandmode
sudo make install-init
sudo make install-config
sudo make install-webconf
In order to issue external commands via the web interface to Nagios, we must add the web server user, apache, to the nagcmd group:
sudo usermod -G nagcmd apachInstall Nagios Plugins
Find the latest release of Nagios Plugins here: Nagios Plugins Download. Copy the link address for the latest version, and copy the link address so you can download it to your Nagios server.
At the time of this writing, the latest version is Nagios Plugins 2.1.1. Download it to your home directory with curl:
cd ~
curl -L -O http://nagios-plugins.org/download/nagios-plugins-2.1.1.tar.gz
Extract Nagios Plugins archive with this command:
tar xvf nagios-plugins-*.tar.gz
Then change to the extracted directory:
cd nagios-plugins-*
Before building Nagios Plugins, we must configure it. Use this command:
./configure --with-nagios-user=nagios --with-nagios-group=nagios --with-openssl
Now compile Nagios Plugins with this command:
make
Then install it with this command:
sudo make install
Install NRPE
Find the source code for the latest stable release of NRPE at the NRPE downloads page. Download the latest version to your Nagios server.
At the time of this writing, the latest release is 2.15. Download it to your home directory with curl:
- cd ~
- curl -L -O http://downloads.sourceforge.net/project/nagios/nrpe-2.x/nrpe-2.15/nrpe-2.15.tar.gz
Extract the NRPE archive with this command:
- tar xvf nrpe-*.tar.gz
Then change to the extracted directory:
- cd nrpe-*
Configure NRPE with these commands:
- ./configure –enable-command-args –with-nagios-user=nagios –with-nagios-group=nagios –with-ssl=/usr/bin/openssl –with-ssl-lib=/usr/lib/x86_64-linux-gnu
Now build and install NRPE and its xinetd startup script with these commands:
- make all
- sudo make install
- sudo make install-xinetd
- sudo make install-daemon-config
Open the xinetd startup script in an editor:
- sudo vi /etc/xinetd.d/nrpe
Modify the only_from line by adding the private IP address of the your Nagios server to the end (substitute in the actual IP address of your server):
only_from = 127.0.0.1 10.132.224.168
Save and exit. Only the Nagios server will be allowed to communicate with NRPE.
Restart the xinetd service to start NRPE:
- sudo service xinetd restart
Now that Nagios 4 is installed, we need to configure it.
Configure Nagios
Now let’s perform the initial Nagios configuration. You only need to perform this section once, on your Nagios server.
Organize Nagios Configuration
Open the main Nagios configuration file in your favorite text editor. We’ll use vi to edit the file:
sudo vi /usr/local/nagios/etc/nagios.cfg
Now find an uncomment this line by deleting the #:
#cfg_dir=/usr/local/nagios/etc/servers
Save and exit.
Now create the directory that will store the configuration file for each server that you will monitor:
sudo mkdir /usr/local/nagios/etc/servers
Configure Nagios Contacts
Open the Nagios contacts configuration in your favorite text editor. We’ll use vi to edit the file:
sudo vi /usr/local/nagios/etc/objects/contacts.cfg
Find the email directive, and replace its value (the highlighted part) with your own email address:
email nagios@localhost ; <<***** CHANGE THIS TO YOUR EMAIL ADDRESS ******
Save and exit.
Configure check_nrpe Command
Let’s add a new command to our Nagios configuration:
- sudo vi /usr/local/nagios/etc/objects/commands.cfg
Add the following to the end of the file:
define command{
command_name check_nrpe
command_line $USER1$/check_nrpe -H $HOSTADDRESS$ -c $ARG1$
}
Save and exit. This allows you to use the check_nrpe command in your Nagios service definitions.
Configure Apache
Use htpasswd to create an admin user, called “nagiosadmin”, that can access the Nagios web interface:
sudo htpasswd -c /usr/local/nagios/etc/htpasswd.users nagiosadmin
Enter a password at the prompt. Remember this login, as you will need it to access the Nagios web interface.
Note: If you create a user that is not named “nagiosadmin”, you will need to edit /usr/local/nagios/etc/cgi.cfg and change all the “nagiosadmin” references to the user you created.
Nagios is ready to be started. Let’s do that, and restart Apache:
sudo systemctl start nagios.service
sudo systemctl restart httpd.service
To enable Nagios to start on server boot, run this command:
sudo chkconfig nagios on
Optional: Restrict Access by IP Address
If you want to restrict the IP addresses that can access the Nagios web interface, you will want to edit the Apache configuration file:
sudo vi /etc/httpd/conf.d/nagios.conf
Find and comment the following two lines by adding # symbols in front of them:
Order allow,deny
Allow from all
Then uncomment the following lines, by deleting the # symbols, and add the IP addresses or ranges (space delimited) that you want to allow to in the Allow from line:
# Order deny,allow
# Deny from all
# Allow from 127.0.0.1
As these lines will appear twice in the configuration file, so you will need to perform these steps once more.
Save and exit.
Now start Nagios and restart Apache to put the change into effect:
sudo systemctl restart nagios.service
sudo systemctl restart httpd.service
Nagios is now running, so let’s try and log in.
Accessing the Nagios Web Interface
Open your favorite web browser, and go to your Nagios server (substitute the IP address or hostname for the highlighted part):
http://nagios_server_public_ip/nagios
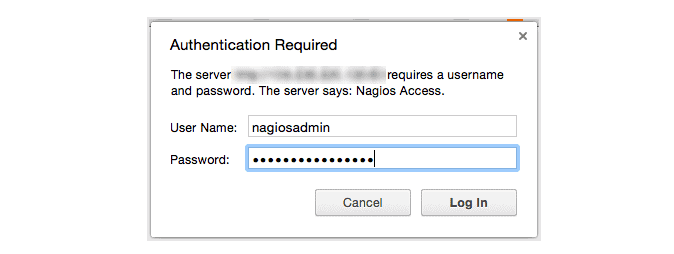
Because we configured Apache to use htpasswd, you must enter the login credentials that you created earlier. We used “nagiosadmin” as the username:

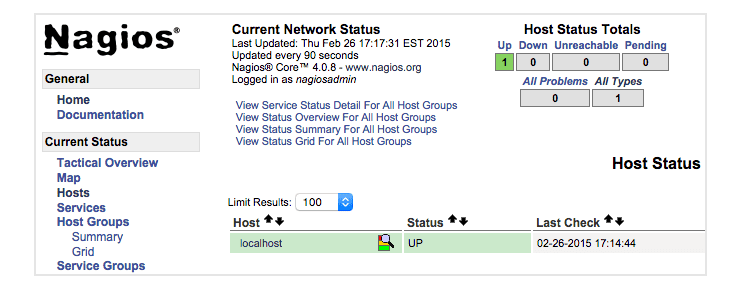
After authenticating, you will be see the default Nagios home page. Click on the Hosts link, in the left navigation bar, to see which hosts Nagios is monitoring:

As you can see, Nagios is monitoring only “localhost”, or itself.
Let’s monitor another host with Nagios!
Monitor a CentOS 7 Host with NRPE
In this section, we’ll show you how to add a new host to Nagios, so it will be monitored. Repeat this section for each CentOS or RHEL server you wish to monitor.
Note: If you want to monitor an Ubuntu or Debian server, follow the instructions in this link: Monitor an Ubuntu Host with NRPE.
On a server that you want to monitor, install the EPEL repository:
sudo yum install epel-release
Now install Nagios Plugins and NRPE:
sudo yum install nrpe nagios-plugins-all
Now, let’s update the NRPE configuration file. Open it in your favorite editor (we’re using vi):
sudo vi /etc/nagios/nrpe.cfg
Find the allowed_hosts directive, and add the private IP address of your Nagios server to the comma-delimited list (substitute it in place of the highlighted example):
allowed_hosts=127.0.0.1,10.132.224.168
Save and exit. This configures NRPE to accept requests from your Nagios server, via its private IP address.
Restart NRPE to put the change into effect:
sudo systemctl start nrpe.service
sudo systemctl enable nrpe.service
Once you are done installing and configuring NRPE on the hosts that you want to monitor, you will have to add these hosts to your Nagios server configuration before it will start monitoring them.
Add Host to Nagios Configuration
On your Nagios server, create a new configuration file for each of the remote hosts that you want to monitor in /usr/local/nagios/etc/servers/. Replace the highlighted word, “yourhost”, with the name of your host:
sudo vi /usr/local/nagios/etc/servers/yourhost.cfg
Add in the following host definition, replacing the host_name value with your remote hostname (“web-1” in the example), the alias value with a description of the host, and the address value with the private IP address of the remote host:
define host {
use linux-server
host_name yourhost
alias My first Apache server
address 10.132.234.52
max_check_attempts 5
check_period 24x7
notification_interval 30
notification_period 24x7
}
With the configuration file above, Nagios will only monitor if the host is up or down. If this is sufficient for you, save and exit then restart Nagios. If you want to monitor particular services, read on.
Add any of these service blocks for services you want to monitor. Note that the value of check_command determines what will be monitored, including status threshold values. Here are some examples that you can add to your host’s configuration file:
Ping:
define service {
use generic-service
host_name yourhost
service_description PING
check_command check_ping!100.0,20%!500.0,60%
}
SSH (notifications_enabled set to 0 disables notifications for a service):
define service {
use generic-service
host_name yourhost
service_description SSH
check_command check_ssh
notifications_enabled 0
}
If you’re not sure what use generic-service means, it is simply inheriting the values of a service template called “generic-service” that is defined by default.
Now save and quit. Reload your Nagios configuration to put any changes into effect:
sudo systemctl reload nagios.service
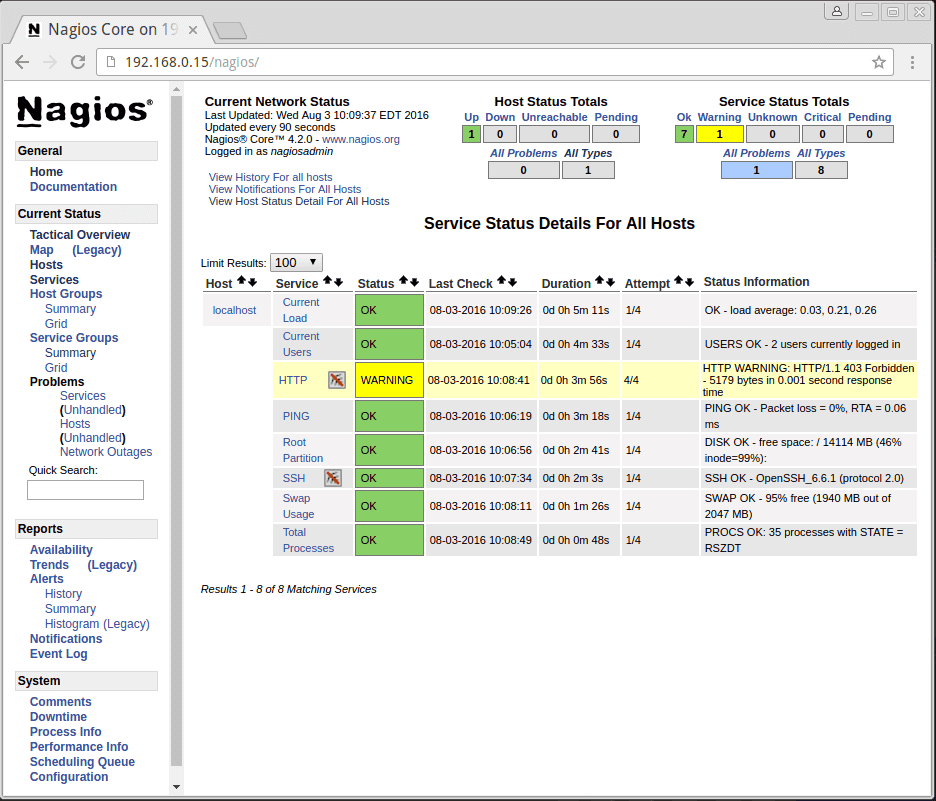
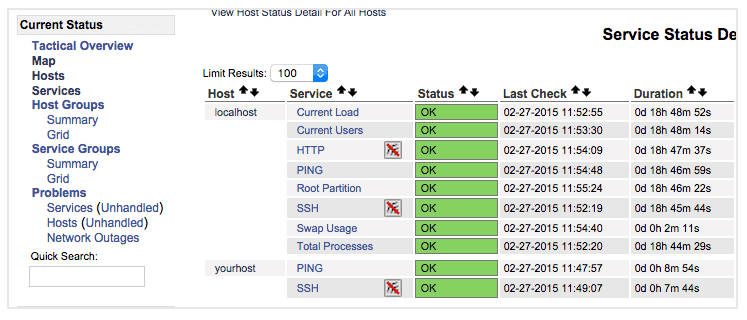
Once you are done configuring Nagios to monitor all of your remote hosts, you should be set. Be sure to access your Nagios web interface, and check out the Services page to see all of your monitored hosts and services:

Have fun!
CentOS 7 security update patches five critical vulnerabilities

CentOS has received a new update that fixes important kernel vulnerabilities. The update has been specifically designed for systems running on CentOS 7.
Johnny Hughes, the maintainer of CentOS, has published a security advisory detailing the five vulnerabilities addressed by the latest update. Hughes highlights that the update fixes a remote code execution vulnerability (CVE-2017-7477). The vulnerability could allow remote attackers escalate privileges by allocating heap memory in Linux kernel to build the scatter gather list from fragment list in the socket buffer.
Another remote code execution vulnerability (CVE-2017-7645) has been patched in the update. The vulnerability affected NFS2/3 RPC client that could let users send long arguments to the NFS server and let an attacker crash the kernel.
Third important vulnerability (CVE-2017-7895) patched in this security release was discovered in NFSv2 and NFSv3 server implementations. Another vulnerability (CVE-2017-2583) was found in virtual machine support in the kernel while the last important security flaw (CVE-2017-6214) was found in the kernel’s packet handling with URG flags. A remote attacker could force the kernel to enter an infinite loop using this vulnerability.
The CentOS maintainer has pushed the update kernel-3.10.0-514.26.1.el7 in the stable repository of the OS. All the CentOS 7 users are recommended to update their systems immediately.
Cannot install plugin in wordpress + could not create directory
Running a CentOS Server with Webmin and Virtualmin,
# could not create directory
In Virtualmin select the domain name that have a problem and go change the Enable safe mode in /Virtualmin/Services/PHP Configuration
Disable safe mode!

Also there is other stuff to look for…
- Make sure the directory and all files are CHOWN to the good user
- You should also add this in your wp-config
define(‘FS_METHOD’, ‘direct’);
😉


